Bayesian vs. Frequentist — Why Lyftio chooses Bayesian for better decisions
Both Bayesian and frequentist approaches can power A/B testing, but they answer different questions. Frequentist methods tell you how surprising the data would be if there were no effect. Bayesian methods tell you the thing you actually want to know: the probability that Variant B is better than A. Lyftio uses a Bayesian engine because it delivers clearer decisions, safer stopping, and revenue‑aware insights without torturing teams with p‑values and arbitrary thresholds.
The question product teams really ask
-
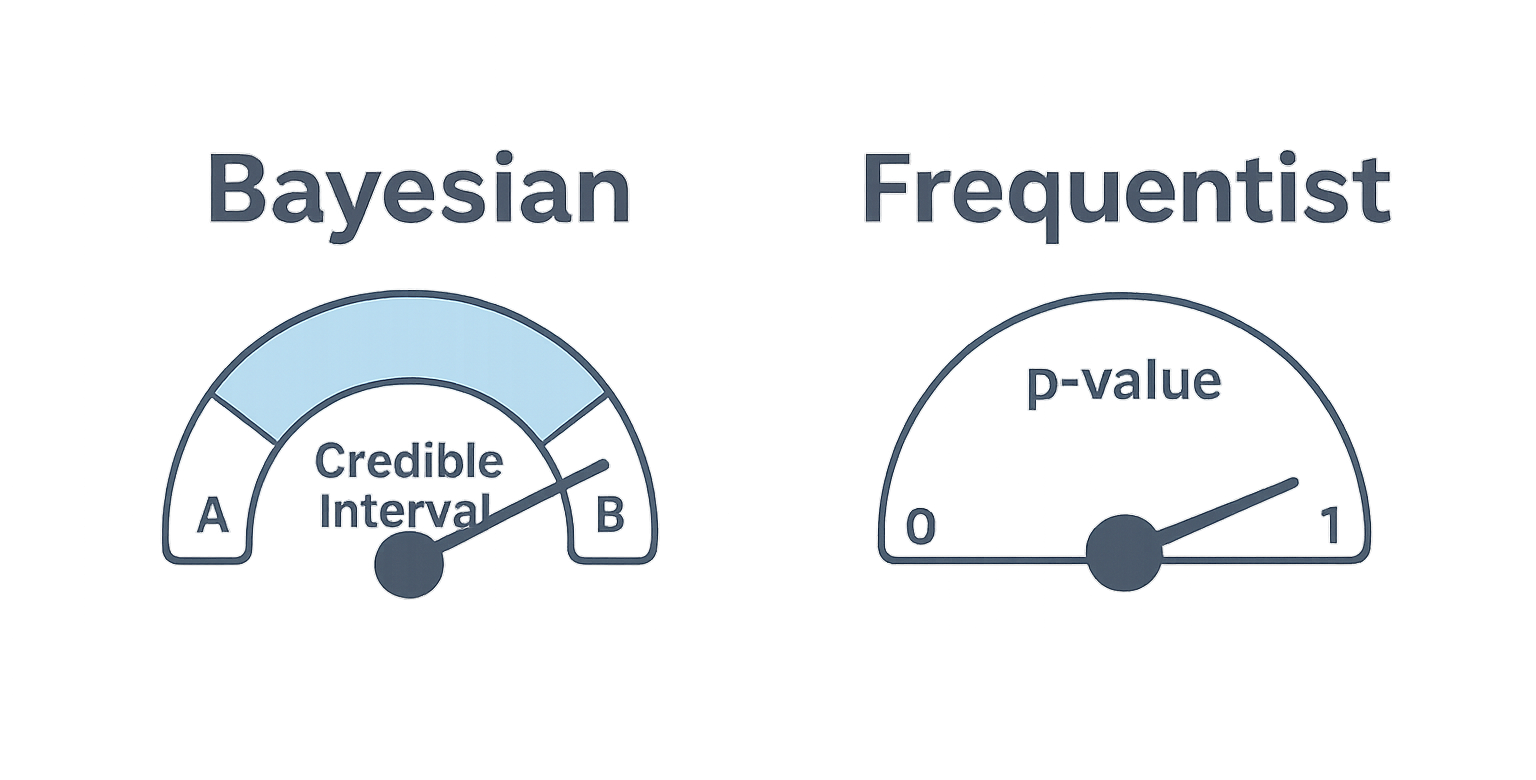
Frequentist: “If A and B were actually the same, what’s the probability I’d see a difference this big or bigger?” → p‑value.
-
Bayesian: “Given the data I observed, what’s the probability B is better than A, and by how much?” → P(B>A) and credible intervals.
Only one of these maps directly to prioritization and rollout decisions.
Practical advantages of Bayesian for A/B testing
- Actionable probabilities (P(B>A)). Get a direct probability that the variant wins and by how much (e.g., “There’s a 93% chance B increases conversion by ≥2%”). No p‑value translation needed.
- Credible intervals you can explain. A 95% credible interval means “there’s a 95% probability the true lift lies in this range.” That’s intuitive for non‑statisticians.
- Honest, flexible stopping.
Bayesian sequential monitoring avoids the p‑hacking pitfalls of repeated peeking. You can evaluate as data arrives and stop when your decision criteria are met
P(B>A)>95% or Pr(loss>1%)<5%. - Natural treatment of revenue metrics. Revenue is zero‑inflated and skewed. Lyftio’s Bayesian hurdle models (conversion × order value) capture this structure, producing more stable metrics and better risk controls.
- Decisioning with business thresholds.
Encode risk appetite directly: “Ship only if probability of losing ≥1% revenue is under 2%.” This is far more aligned to P&L than a
p<0.05ritual. - Small‑sample resilience. Bayesian models use prior information (weakly informative by default) to stabilize early results, reducing wild swings and false alarms.
Example (conversion rate)
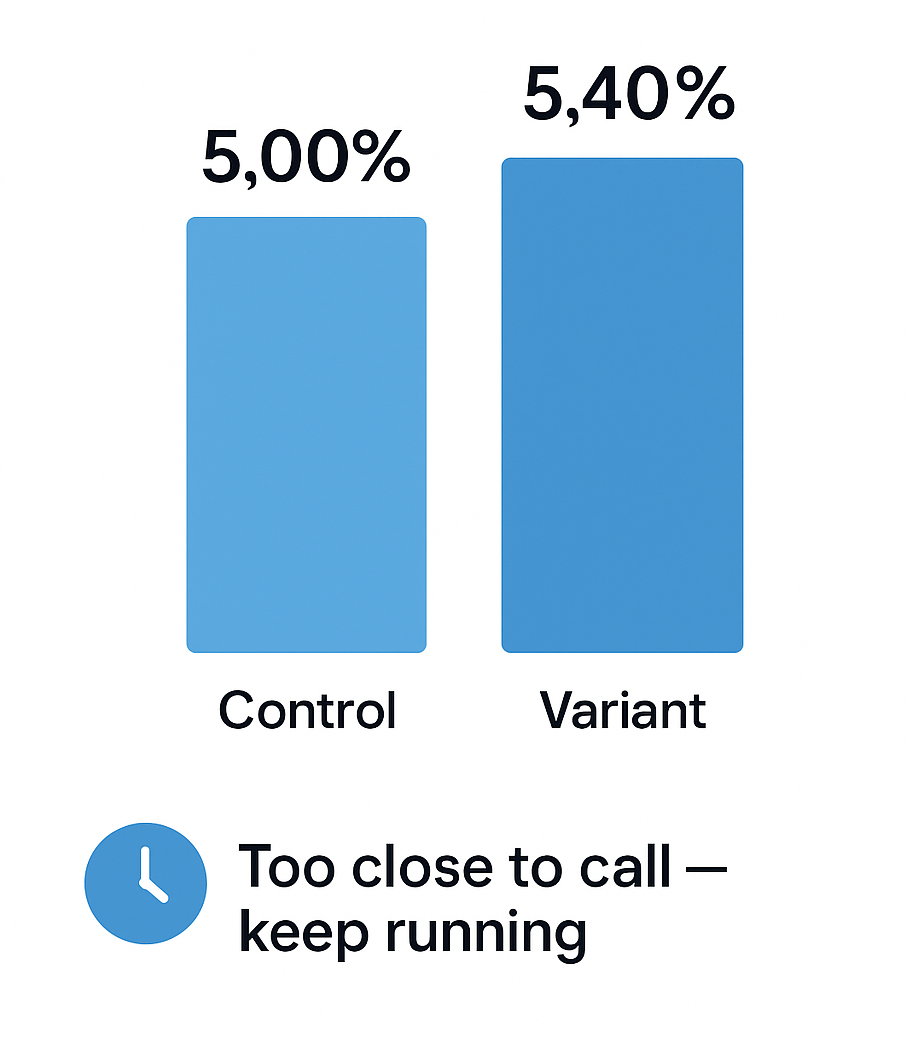
Suppose Control converts 500/10,000 (5.00%) and Variant converts 540/10,000 (5.40%).
Frequentist: p≈0.11 → “Not significant.” No decision guidance.
Bayesian: P(B>A)≈0.90; 95% credible interval for lift ≈ [−0.1%, +0.9%].
Decision view: If your rule is “Ship when P(B>A)≥95% or when Expected Value > 0 with risk of ≥1% loss < 5%,” you’d likely keep running. Clear, actionable, and honest about uncertainty.