Revenue A/B Testing — how Lyftio turns experiments into profit
What is Revenue A/B testing?
Revenue A/B testing measures the money impact of a change—not just clicks or sign‑ups. Instead of stopping at conversion rate, you evaluate Average Revenue per Visitor (ARPV) and related profit metrics so you can ship ideas that actually grow sales.
Key revenue metrics
-
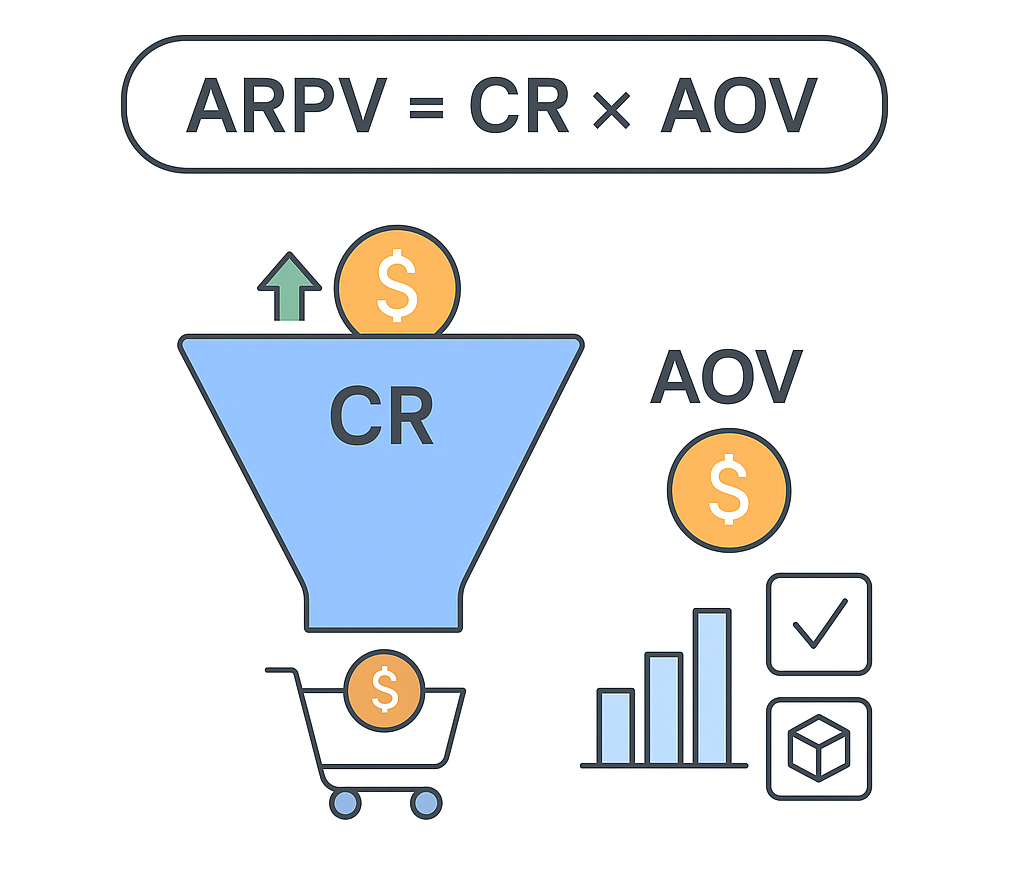
Conversion rate (CR): share of visitors who place an order.
-
Average order value (AOV): revenue per order.
-
ARPV: revenue per visitor = CR × AOV.
-
Probability that the change will increase/reduce revenue
Bottom line: Revenue A/B testing asks, “How much money will this change make—or lose—per visitor?”
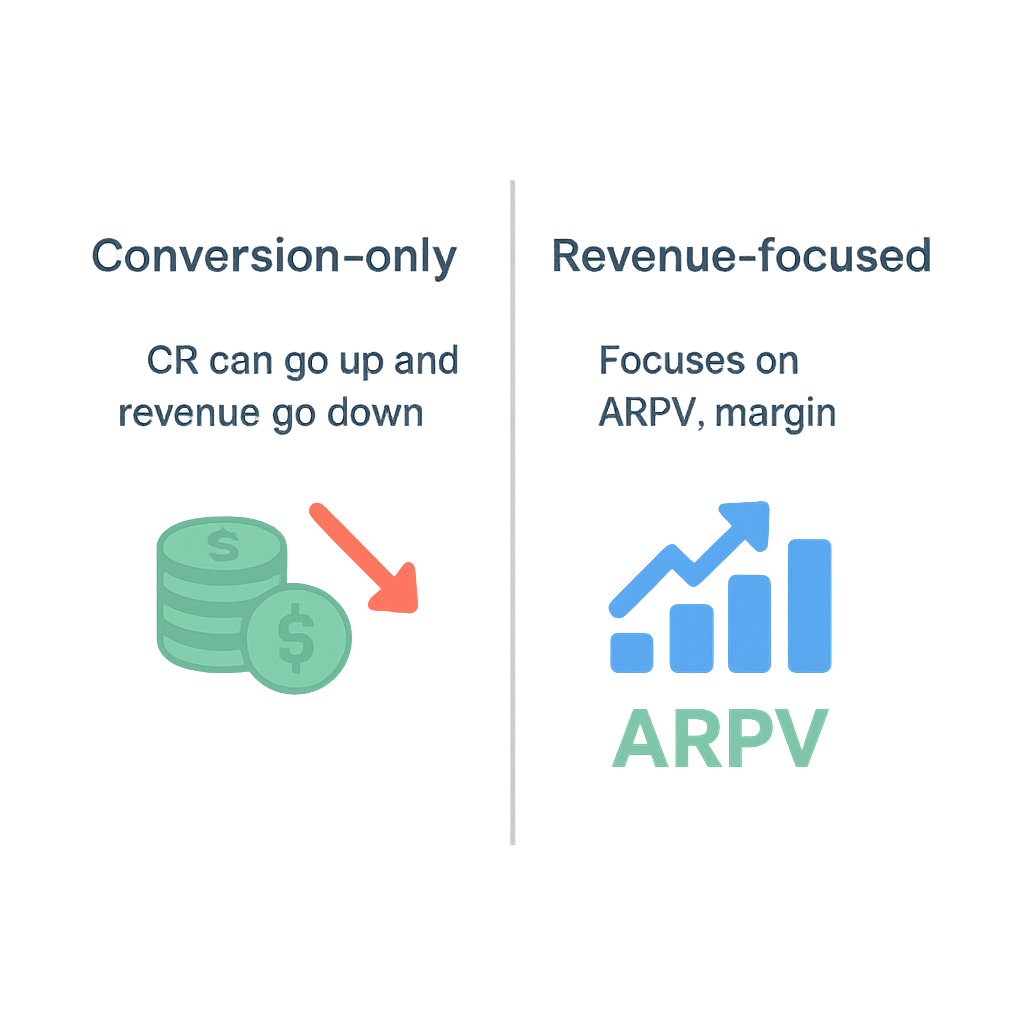
Why revenue beats vanilla conversion testing
Avoids false wins where a higher CR hides a lower AOV (or vice versa).
Optimizes for profit, not vanity metrics, using margin‑aware goals.
Surfaces trade‑offs (e.g., free shipping boosts CR but cuts margin) so you can tune thresholds.
Lyftio’s approach
-
Revenue‑native Bayesian engine
Lyftio models revenue with a hurdle structure: a Bernoulli layer for conversion and a skew‑aware layer (Gamma/Log‑Normal) for order value.You get: Probability the variant increases ARPV: P(ARPV_B > ARPV_A) Expected lift with credible intervals Downside risk against your business rule, e.g. P(loss > 1%) < 5%
-
Decision rules you can explain
Ship when either condition is met:P(B>A) > 95% OR P(loss > 1%) < 5%This turns uncertainty into a simple Ship / Keep Running / Roll Back decision. -
Secure revenue capture
Revenue data are sent straight to our API from your website, keeping revenue data accurate, secure, and in lockstep with your checkout. -
Segments
Break out results by traffic source, device, geography, and new vs. returning. Identify where a change prints money—and where it doesn’t.